F1 AI
Formula 1 race analysis, an MCP server that gives AI assistants real timing data, and a pipeline that reads telemetry off onboard video. Open source, no API keys.
São Paulo Grand Prix 2026
Race · Interlagos, Brazil · 08 November 2026
| Pos | Driver | Team | Grid | +/- | Gap | Pts | Best lap |
|---|---|---|---|---|---|---|---|
| 1 | Lando Norris | McLaren | 1 | Winner | 25 | 1:12.983 | |
| 2 | Max Verstappen | Red Bull Racing | 21 | +19 | +14.602 | 18 | 1:13.131 |
| 3 | Isack Hadjar | Red Bull Racing | 5 | +2 | +24.485 | 15 | 1:12.877 |
| 4 | George Russell | Mercedes | 7 | +3 | +33.991 | 12 | 1:14.040 |
| 5 | Kimi Antonelli | Mercedes | 2 | -3 | +41.017 | 10 | 1:12.689 |
| 6 | Oscar Piastri | McLaren | 10 | +4 | +56.475 | 8 | 1:13.018 |
| 7 | Liam Lawson | Racing Bulls | 3 | -4 | +75.402 | 6 | 1:13.495 |
| 8 | Charles Leclerc | Ferrari | 14 | +6 | +78.586 | 4 | 1:14.170 |
| 9 | Lewis Hamilton | Ferrari | 20 | +11 | +1 LAP | 2 | 1:13.724 |
| 10 | Nico Hulkenberg | Audi | 4 | -6 | +1 LAP | 1 | 1:14.000 |
| 11 | Arvid Lindblad | Racing Bulls | 18 | +7 | +1 LAP | 0 | 1:14.004 |
| 12 | Fernando Alonso | Aston Martin | 8 | -4 | +1 LAP | 0 | 1:14.706 |
| 13 | Franco Colapinto | Alpine | 13 | +1 LAP | 0 | 1:13.710 | |
| 14 | Pierre Gasly | Alpine | 15 | +1 | +1 LAP | 0 | 1:14.462 |
| 15 | Alexander Albon | Williams | 9 | -6 | +1 LAP | 0 | 1:14.464 |
| 16 | Gabriel Bortoleto | Audi | 19 | +3 | +1 LAP | 0 | 1:14.940 |
| 17 | Oliver Bearman | Haas F1 Team | 6 | -11 | +1 LAP | 0 | 1:14.036 |
| 18 | Sergio Perez | Cadillac | 22 | +4 | +2 LAPS | 0 | 1:16.123 |
| 19 | Carlos Sainz | Williams | 12 | -7 | +2 LAPS | 0 | 1:14.613 |
| 20 | Rafael Camara | Haas F1 Team | 11 | -9 | +2 LAPS | 0 | 1:14.369 |
| - | Lance Stroll | Aston Martin | 16 | DNF | 0 | 1:17.430 | |
| - | Valtteri Bottas | Cadillac | 17 | DNS | 0 | - |
Dotted lines are the second driver of each team. Hover a line for the driver and position.
Pace and tyres
Who was actually quick, once pit laps, safety-car laps and traffic-slow laps are removed.
Tyre model and strategy
Mexico City Grand Prix 2026. The São Paulo Grand Prix was run in mixed conditions, where a dry-tyre model does not apply, so this shows the most recent dry race.
What the winner (VER) actually ran: M 27 – S 18 – S 26 laps. A least-squares model separates driver pace, tyre wear per compound and fuel burn; strategies are then ranked by predicted race time. It assumes clear air, no safety cars and linear tyre wear, with stints capped at the longest run seen on each compound.
Telemetry: the top two in qualifying
São Paulo Grand Prix 2026 qualifying. Each driver's fastest lap of the session, lined up by GPS position.
| Corner | Distance | Min speed NOR | Min speed RUS | Time gained by NOR |
|---|---|---|---|---|
| T1 | 362 | 81.1 | 85.0 | -0.045 |
| T2 | 462 | 85.9 | 86.6 | -0.068 |
| T3 | 646 | 172.7 | 177.9 | -0.075 |
| T4 | 1396 | 111.2 | 118.1 | -0.102 |
| T5 | 1564 | 153.9 | 158.7 | -0.163 |
| T6 | 2006 | 159.1 | 170.0 | -0.064 |
| T7 | 2142 | 157.5 | 168.2 | -0.069 |
| T8 | 2304 | 72.5 | 65.4 | 0.068 |
| T9 | 2433 | 83.4 | 83.2 | -0.038 |
| T10 | 2724 | 66.1 | 68.0 | -0.11 |
| T11 | 2941 | 173.4 | 164.2 | 0.11 |
| T12 | 3230 | 92.1 | 79.0 | 0.086 |
| T13 | 3348 | 113.5 | 100.3 | 0.128 |
| T14 | 3602 | 246.7 | 240.4 | -0.03 |
| T15 | 4009 | 285.0 | 289.0 | -0.022 |
Sector-level gaps match official timing to a few hundredths of a second. Corner-level numbers are indicative: the public feed samples the car about four times a second.
Video to telemetry
Reading speed, gear, throttle, brake and RPM straight off the pixels of an onboard video.
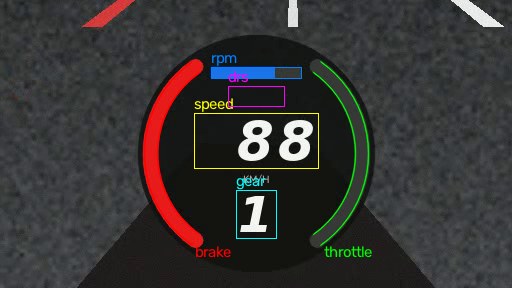
Measured on footage this project renders itself. Real broadcast video has a different HUD design and needs its own layout profile, calibrated in the dashboard; that has not been tested yet.
Championship
2026 standings after round 20.
The project
This page is a snapshot. The full project runs on your own machine, for any session, with no API keys.
Dashboard
A Streamlit app with six views over any session since 2023: race, pace and tyres, telemetry, video lab, championship. Everything on this page comes from it.
MCP server
13 tools that let an AI assistant such as Claude answer F1 questions with real numbers instead of guessing.
Data analysis
Clean-lap pace, a fuel-corrected tyre model, measured pit loss, strategy ranking and GPS-aligned lap comparison.
Video to telemetry
Turns an onboard video's HUD into a telemetry CSV, with a renderer that makes test footage to measure accuracy against.
Run it
git clone https://github.com/muzzkh/f1-ai.git
cd f1-ai
python -m venv .venv
.venv/Scripts/python -m pip install -e .        # macOS / Linux: .venv/bin/python
.venv/Scripts/python -m streamlit run dashboard/app.py
MCP tools
| Tool | What it does |
|---|---|
| get_schedule | Race calendar for a season: round numbers, event names, dates, which sessions each weekend has, and whether it has already been run. |
| get_standings | Current (or final) driver and constructor championship standings for a season. |
| get_session_results | Classification of a session. Races: position, grid, gap to winner, status, points. Qualifying: Q1/Q2/Q3 times. Also weather and each driver's best lap. |
| get_lap_times | Every lap of one driver: lap time, sectors, tyre compound and age, position, pit in/out flags and track status (GREEN / SC / VSC / RED). |
| get_race_pace | Drivers ranked by representative pace: median of clean laps (green flag, no pit laps, within 107% of the fastest), with gap to the quickest. |
| get_tyre_strategy | What each driver ran: every stint with compound, lap range, tyre age at the start and median clean pace. |
| get_tyre_degradation | Fitted race pace model: how much slower each dry compound gets per lap of age, pace offset between compounds, the fuel-burn effect, each driver's underlying pace, plus measured pit-stop time loss. A simple linear model; treat the numbers as estimates and check r2. |
| simulate_race_strategy | Rank dry-tyre pit strategies for a race by predicted total time using the fitted degradation model and measured pit loss, and show what the winner actually did. Ignores traffic, safety cars and track evolution. |
| compare_drivers | Head-to-head telemetry comparison of two laps (each driver's fastest unless lap numbers are given): lap summaries, minimum speed and time gained at every corner, and time gained in each of 25 slices of the lap. Positive gain_a values mean driver A was faster there. Corner-level numbers are indicative (about +/-0.05 s). |
| get_lap_telemetry | Telemetry trace of one lap (fastest if no lap number), resampled to `points` evenly spaced distances: speed, throttle, brake, gear, RPM, DRS. |
| list_hud_profiles | HUD layout profiles available for video-to-telemetry extraction. |
| render_onboard_video | Render a lap's real telemetry as an onboard-style video with a HUD overlay (speed, gear, throttle, brake, RPM). Useful as test footage with known ground truth for video_to_telemetry. Returns the file path. |
| video_to_telemetry | Read telemetry (speed, gear, throttle, brake, RPM, DRS) out of an onboard video by analysing its HUD graphics, and save it as CSV. `profile` names the HUD layout (see list_hud_profiles); footage with a different HUD needs its own calibrated profile. If a reference lap is given the result is time-aligned to the official telemetry and its accuracy reported. Check speed_read_rate_pct: a low value means the profile does not fit. |